
Revenue Cyclefor Medical Practices
DataDx helps you know more than ever about patient visits and demographics


Are you truly getting the most out of your patient database? Are you able to identify health trends? Do you have an acute awareness of your new-to-existing patient mix? Is the way you’re using this data today helping you make better decisions about marketing spend, resource allocation, or even expansion opportunities? With DataDx for Medical, you can do all this and more!
Payor Analysis
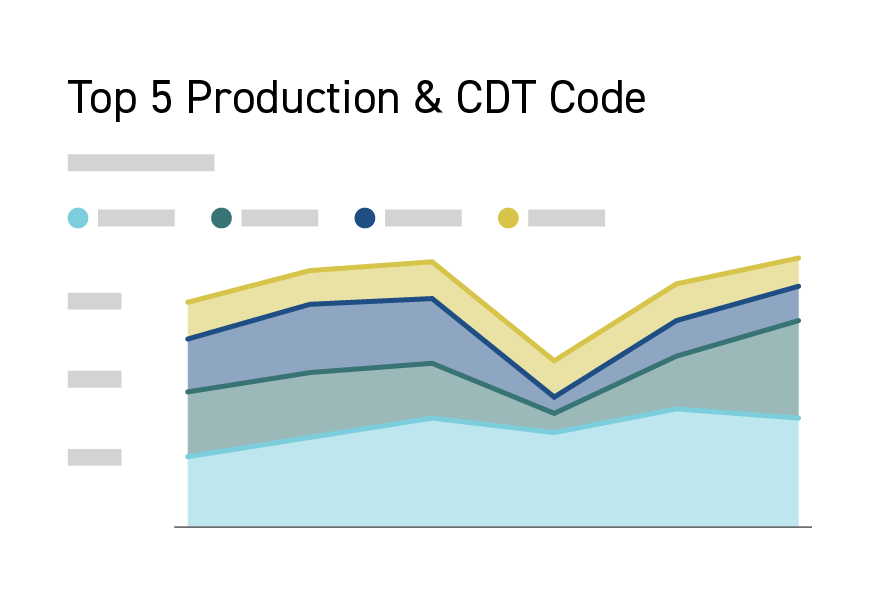
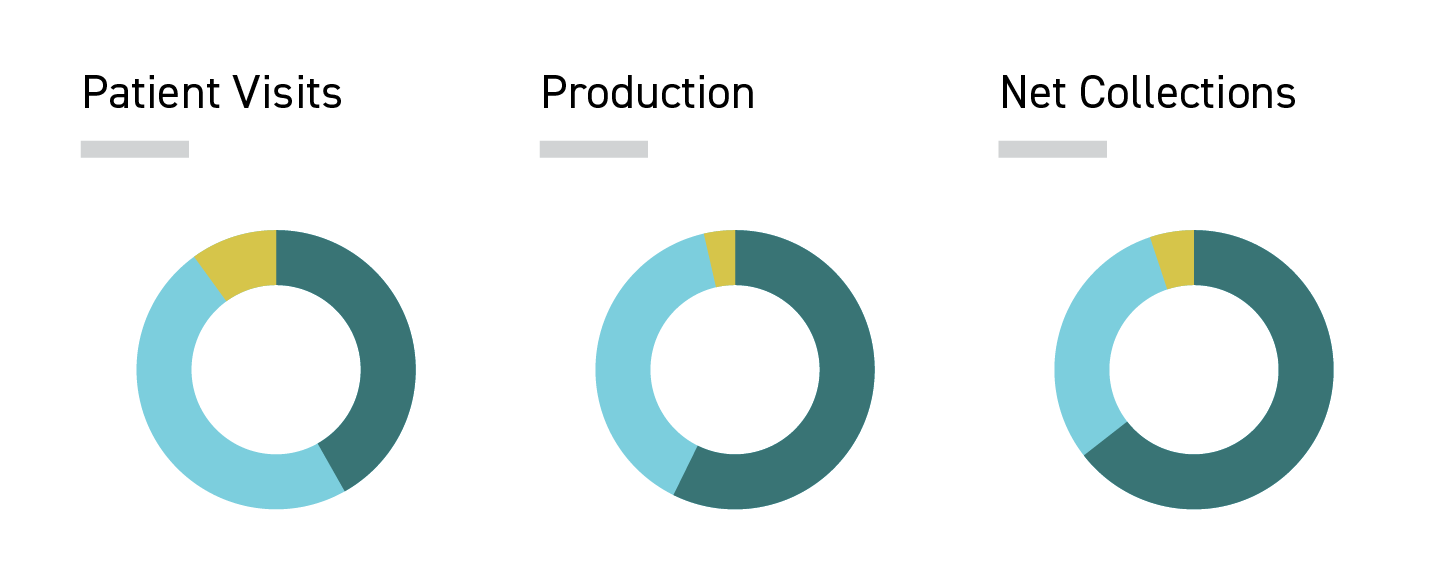
Don’t you wish you could save some of the time you’ve been devoting to managing your payor information? It’s complicated, it’s time consuming, and it distracts you from patient care. Luckily, DataDx has created a report that gives you a summary level view of key statistics like your net collections, payor patient visits, and work RVUs. Need to filter by payor group, location, provider, speciality, department, or CPT code? You can do that, too. And DataDx makes it all possible.
Adjustments
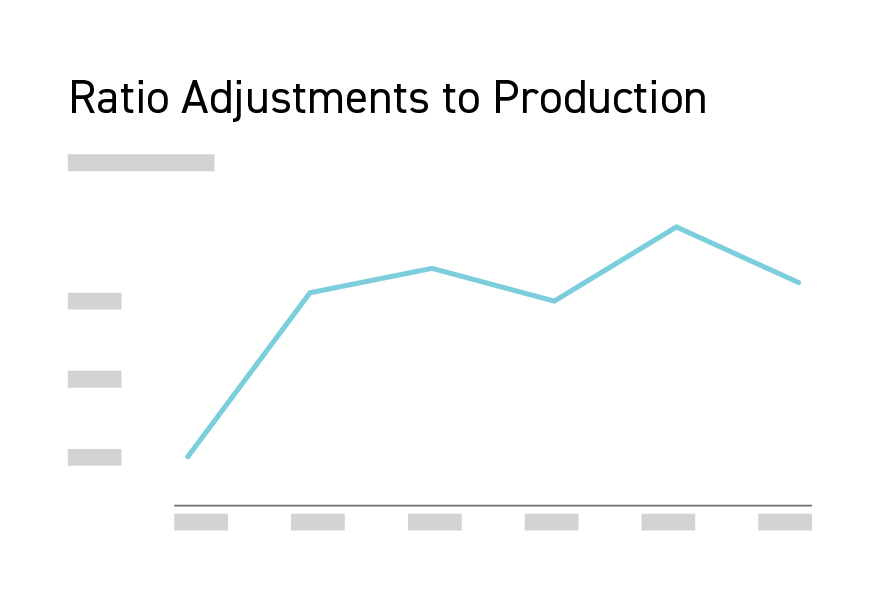
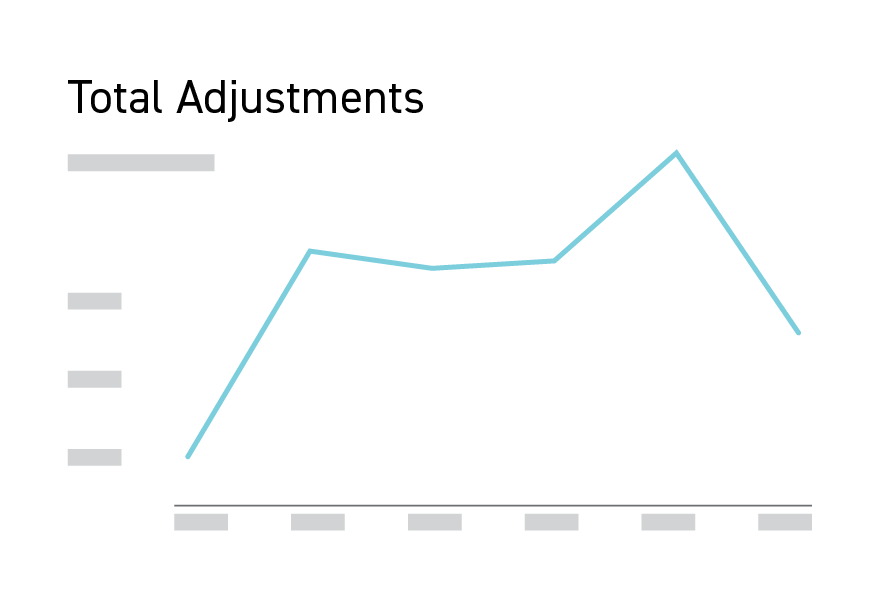
Need a quick view of your total adjusted transactions over a specific period of time? Need to see your adjustments to production ratio? Not only does this report give you this crucial practice information, but you’ll also be able to track your total adjustments across payer groups, but you’ll be able to monitor this data across providers, giving you the real-time data you need to make short and long-term decisions for the future of your practice.
AR Aging
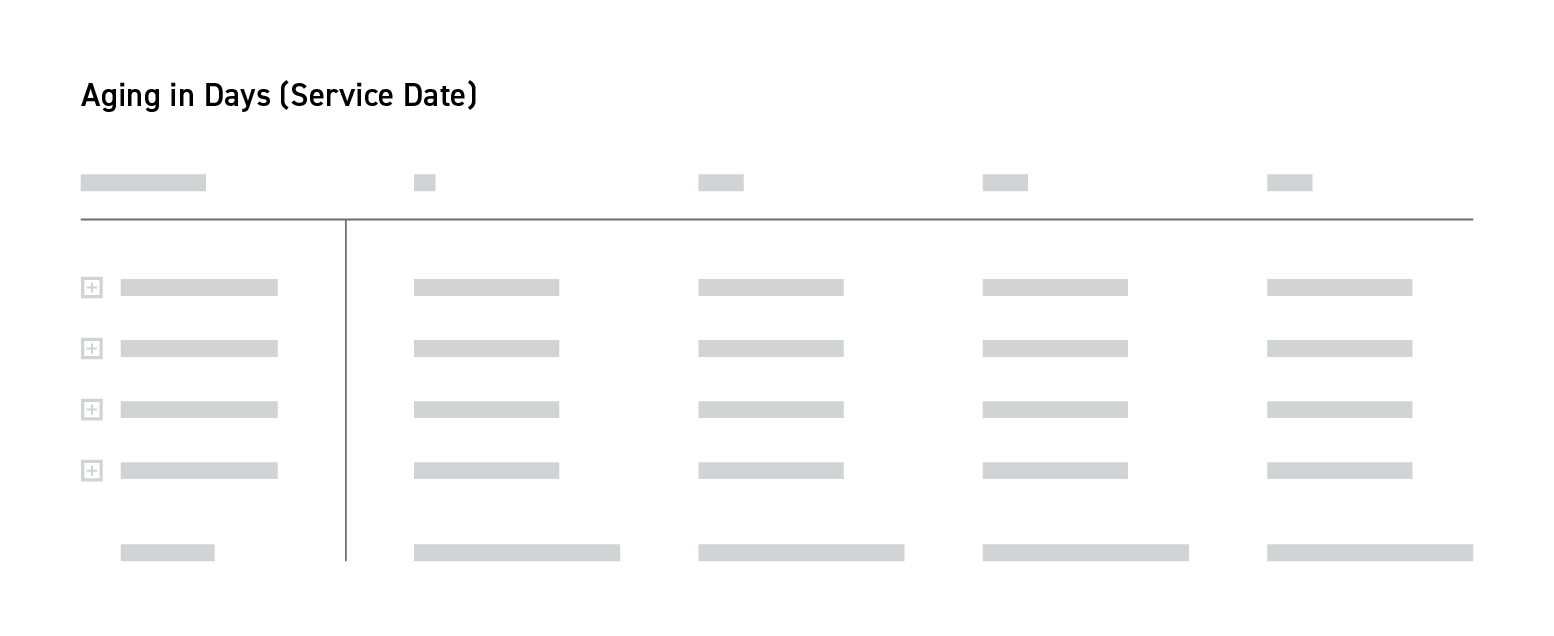
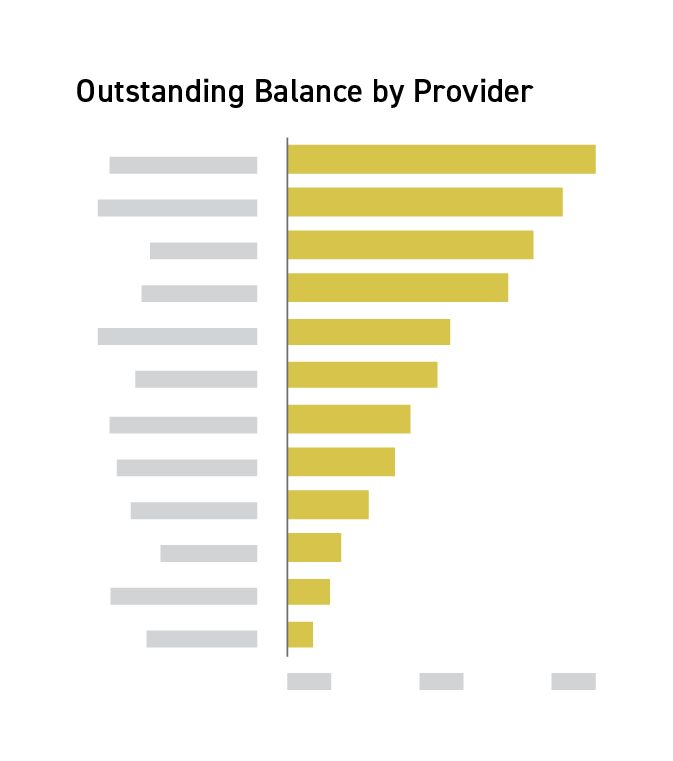
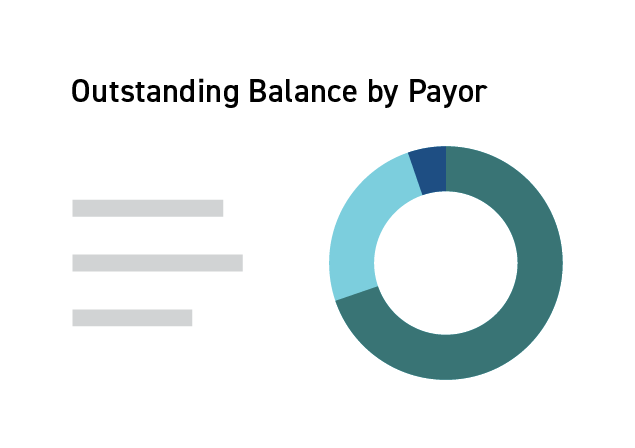
This is one report on aging that you’ll be happy to read! The DataDx Accounts Receivable Aging Report will help you get a clearer picture of your business’s up-to-the moment financial health, including a deeper understanding of your payer’s reliability. Productions, collections, adjustments, and outstanding balances are on full display, including the ability to see individual provider and payer balances, your net collections, and key service dates.



Ready to take full advantage of your practice’s data?
Request a demo to see how DataDx can support your medical practice or organization.
Contact Us